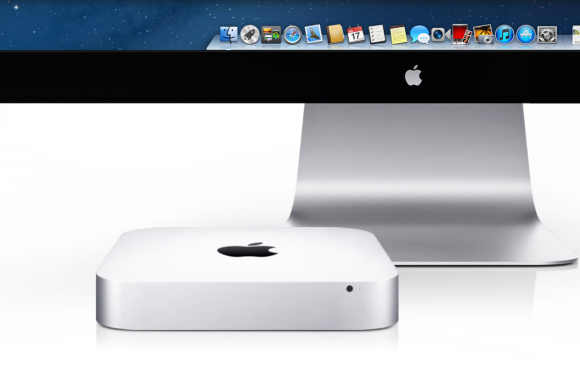
Lab Tested: 2012 Mac mini gets a nice speed boost
Last week, Apple refreshed the Mac mini with faster processors, faster USB 3.0 ports and new graphics. The Macworld Lab was able to get our hands on the new Mac mini systems and our Speedmark 8 test results show the new machines are between 31 and 37 percent faster overall than the Mac minis they replace. The new systems were faster in all of our tests, but processor intensive tests results were only slightly higher. Interestingly, the hard drive tests were much faster on the new systems, though they still use 5400-rpm hard drives.
The new $599 Mac mini has the same 5400-rpm 500GB hard drive and 4GB of RAM as the 2011 entry-level Mac mini, but it gets a speed bump from its previous 2.3GHz dual-core Core i5 processor to a 2.5GHz dual-core Core i5. The new $599 Mac mini still uses integrated graphics, but is updated from the previous Intel HD Graphics 3000 to Intel HD Graphics 4000.
The new $799 Mac mini has a 2.3GHz quad-core Core i7 processor; the previous high-end Mac mini used the same dual-core Core i5 found in the new low-end system. This new model drops the discreet AMD graphics found in last year’s step-up system in favor of Intel’s integrated HD Graphics 4000. As with last year’s $799 system, the new model comes with 4GB of RAM and a 5400-rpm, 1TB hard drive.
2012 Mac mini: Speedmark scores
All results are scores. Higher scores are better. Best result in bold. Reference models in italics. Macworld Lab testing by James Galbraith, Albert Filice, Kean Bartelman, and William Wong.
In our testing, we found the new $599 Mac mini to be 31 percent faster overall than its predecessor. The new Intel HD Graphics 4000 helped the 2012 low-end Mac mini beat last year’s system by 60 percent in the Cinebench OpenGL test and by 27 percent in Portal 2.
We also looked at the performance differences between the new low-end model and a mid-2010 entry-level Mac mini with a 2.4GHz Core 2 Duo processor. The 2012 Mac mini was 68 percent faster and finished the Cinebench CPU test in half the time of the 2010 model. The older system took nearly three times as long to complete our Photoshop action script.
As you’d expect, processor-intensive tests that can use all four cores (and eight virtual cores, thanks to the Core i7’s Hyper Threading technology) showed the new high-end Mac mini to be much faster than the 2011 high-end Mac mini with a dual-core 2.5GHz Core i5 processor. MathematicaMark was 78 percent faster on the new system, Cinebench CPU tests took 53 percent less time to complete, and HandBrake was 24 percent faster than the old model. On the other hand, the previous high-end model, with its discreet AMD Radeon HD 6630M graphics, was faster on GPU-intensive tests, like Portal 2 (9 percent more frames per second) and Cinebench OpenGL (24 percent more frames per second).
If you’re considering whether to buy the entry-level or the higher-end model, our Speedmark 8 results show that the $799 model was 25 percent faster overall, with the biggest gains being in MathematicaMark and Cinebench CPU, which were 78 percent and 53 percent faster, respectively, than the new $599 Mac mini.
Buyers of the $799 Mac mini also have the option of upgrading to Apple’s new hybrid Fusion Drive, which marries 128GB of flash storage with 1TB of standard hard drive for a zippy combination of speed, high capacity, and relatively low cost per gigabyte. The Fusion Drive is only available as a build-to-order option and we are impatiently awaiting our custom system’s arrival.
Check back soon for those results, as well as the full review of the new Mac minis.
2012 Mac mini: Individual application scores
Results are in seconds. Lower results are better. Best result in bold. Reference models in italics.
2012 Mac mini: Individual application scores
Results are in seconds. Lower results are better. Best result in bold. Reference models in italics.
2012 Mac mini: Individual application scores
Results are in seconds. Lower results are better. Best result in bold. Reference models in italics.
2012 Mac mini: Individual application scores
iTunes and Cinebench CPU results are in seconds, (lower results are better). VMware PCMark and MathematicaMark 8 are scores (higher results are better). Best result in bold. Reference models in italics.
2012 Mac minis: Graphics tests
Results are in frames per second. HIgher results are better. Best result in bold. Reference models in italics.
